


Export volume hits a record high in January and February, while concerns arise over the impact of PVC anti-dumping duties on export growth.
Introduction: 2025 At the beginning of the year, China's PVC exports surged, with a year-on-year increase of 85% to 610,000 tons in January-February, setting a historical high for the same period. The global stockpiling trend triggered by changes in tariff policies in the US and India, combined with China's price advantages, has led overseas buyers to seize the 'policy dividend period' before the implementation of India's anti-dumping tax, driving a continuous explosion in export orders. Currently, industry inventory is rapidly depleting, and the overlap of the concentrated replenishment window before the rainy season in Southeast Asia and the policy gap in India from March to April is expected to continue the trend of increased exports. However, attention should be paid to the dual pressure that will arise after May from the implementation of BIS certification and the decline in demand during the off-season.
|
Figure 1: Comparison of PVC Export Destinations in China from 2020 to 2024 (Unit: 10,000 Tons) |
|
|
|
Data source: Customs, LZINFO |
![[隆众聚焦]:一二月出口量创同期新高,PVC反倾销税引出口增长存疑](https://oss.plastmatch.com/zx/image/0a7371e472a54e32bfa18f1b6df85f15.png "[隆众聚焦]:一二月出口量创同期新高,PVC反倾销税引出口增长存疑")
From 2020 to 2024, China's PVC export volume has seen significant growth in recent years, gradually transforming from a net importer to a net exporter. The export volume of PVC in China increased from 630,000 tons in 2020 to 2,617,500 tons in 2024, with a compound annual growth rate of 43%. In 2024, China's total PVC exports reached 2,617,500 tons, with the top five trading partners being India, Vietnam, Thailand, Nigeria, and Uzbekistan, accounting for 68% of the total export volume.
|
Figure 2: Changes in PVC Export Volume and Prices for 2024 (Unit: 10,000 tons, Right Axis: USD/ton) |
|
|
|
Data source: Customs Longzhong Information |
![[隆众聚焦]:一二月出口量创同期新高,PVC反倾销税引出口增长存疑](https://oss.plastmatch.com/zx/image/56c38b1e859949ccbe09480bcfdf4edd.png "[隆众聚焦]:一二月出口量创同期新高,PVC反倾销税引出口增长存疑")
In 2024, China's PVC export volume is expected to reach 2.62 million tons, an increase of 15% compared to 2023. The export volume in March set a new historical high, while the annual low is expected in July, primarily due to the traditional export off-season and reduced procurement by foreign buyers as they avoid risks ahead of the expiration of India's BIS policy.
|
Figure 3 Annual PVC Export Volume and Price Changes for 2024 (Unit: 10,000 tons, Right Axis: USD/ton) |
|
|
|
Data source: Customs Longzhong Information |
![[隆众聚焦]:一二月出口量创同期新高,PVC反倾销税引出口增长存疑](https://oss.plastmatch.com/zx/image/31bf644570e74057a3dfdb90c010bc2f.png "[隆众聚焦]:一二月出口量创同期新高,PVC反倾销税引出口增长存疑")
From January to February 2025, China's PVC exports showed a significant growth trend: exports in January reached 280,000 tons, climbing to 330,000 tons in February, totaling 610,000 tons for the two months. This represents an 85% year-on-year increase compared to the 330,000 tons in the same period in 2024. The main drivers of this growth include the planned tariff increases by the United States and India's implementation of anti-dumping duties and BIS certification policies, which prompted overseas companies to accelerate their procurement. Starting from October 2024, companies expedited stockpiling to avoid policy risks, resulting in sustained export growth. China's PVC, with an FOB price advantage of $610-660 per ton, is $40-80 per ton lower than other producing regions, further strengthening its international competitiveness.
The current industry inventory is accelerating destocking due to increased exports, but risks should be noted: if India's BIS certification policy is strictly enforced, it may suppress demand in the second half of the year. Currently, the backlog of export orders for PVC remains high, coupled with the actual impact of India's anti-dumping duties and BIS certification policies on shipping schedules, which are expected to delay until after May. This means there is still about a two-month policy window for PVC exports to India. It is worth noting that Southeast Asia and India, among other key markets, will enter their traditional rainy season demand lull in May-June. Therefore, overseas buyers are seizing the time window in March-April to restock. The seasonal procurement pattern overlapping with the policy buffer period will drive continuous export shipments of PVC in early二季度, thereby accelerating the domestic industry inventory digestion cycle. (Note: The last part of the original text seems to be cut off or unclear, so I translated up to the point where the sentence structure was still coherent. Please provide the full sentence for a more accurate translation.)
【Copyright and Disclaimer】The above information is collected and organized by PlastMatch. The copyright belongs to the original author. This article is reprinted for the purpose of providing more information, and it does not imply that PlastMatch endorses the views expressed in the article or guarantees its accuracy. If there are any errors in the source attribution or if your legitimate rights have been infringed, please contact us, and we will promptly correct or remove the content. If other media, websites, or individuals use the aforementioned content, they must clearly indicate the original source and origin of the work and assume legal responsibility on their own.
Most Popular
-
Overseas Highlights: PPG Establishes New Aerospace Coatings Plant in the US, Yizumi Turkey Company Officially Opens! Pepsi Adjusts Plastic Packaging Goals
-
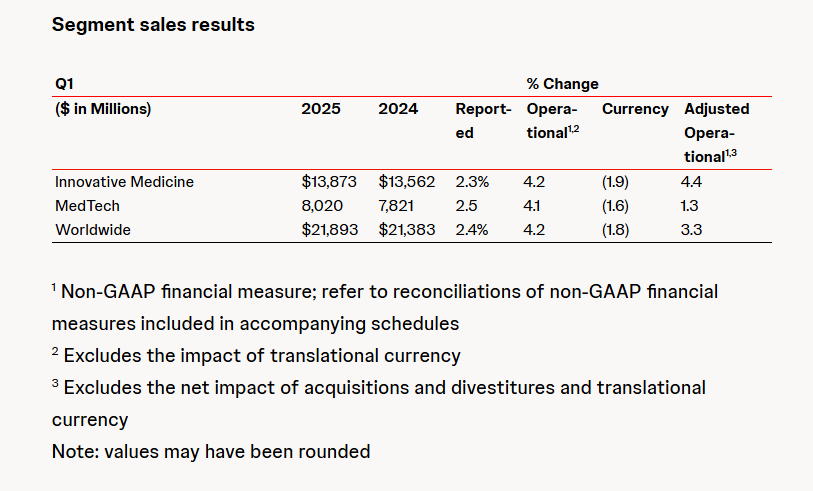
Abbott and Johnson & Johnson: Global Medical Device Giants' Robust Performance and Strategies Amid Tariff Pressures
-

BYD releases 2024 ESG report: Paid taxes of 51 billion yuan, higher than its net profit for the year.
-
Behind pop mart's surging performance: The Plastics Industry Embraces a Revolution of High-End and Green Transformation
-
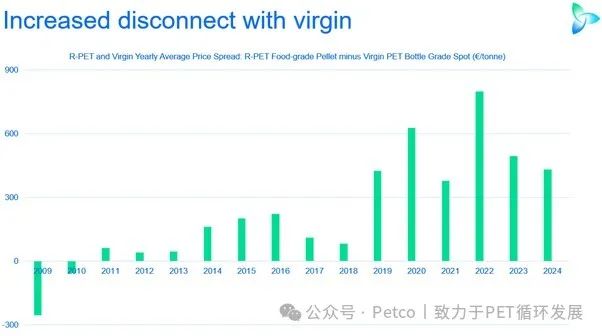
The price difference between recycled and virgin PET has led brands to be cautious in their procurement, even settling for the minimum requirements.