


Middle East Tension Spikes Global Energy Pattern, Crude Oil and Plastic Industries Face Multiple Challenges
On February 28, 2026, Israel, in coordination with the United States, launched a large-scale military strike against Iran, prompting Iran to initiate the "Real Promise 4" retaliation operation, dramatically escalating the geopolitical conflict in the Middle East.
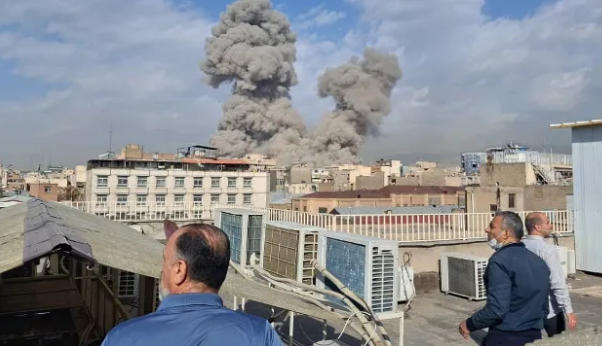
Photo: Smoke from an explosion on February 28 in Tehran, Iran (Source: Xinhua)
As a critical global hub for oil transportation, the Strait of Hormuz is facing an urgent shipping security crisis. The strait, which handles a significant share of the world's crude oil and liquefied natural gas shipments and is known as the "world's oil valve," has seen conflicts directly disrupting the stability of the global crude oil supply chain, triggering severe volatility in the international crude oil market. The plastics industry, which heavily relies on crude oil as a raw material, will also face multiple challenges.
This conflict was not accidental; tensions between the U.S. and Iran had been escalating continuously prior to the outbreak, and the intensification of military confrontation directly triggered heightened sensitivity across global energy markets. As a major oil-producing country in the Middle East, Iran controls the Strait of Hormuz—a critical maritime route. Immediately following the outbreak of the conflict, the Baltic and International Maritime Council (BIMCO) issued a warning, explicitly stating that shipping risks in the Persian Gulf had sharply increased and that vessels associated with the U.S. and Israel faced a significantly higher probability of attack, placing evident pressure on the global crude oil supply chain.
Crude oil market fluctuates, with geopolitical premium driving price movements.
Geopolitical risk premium has become the core driver of rising oil prices, with well-known macro strategist Michael Ball pointing out that conflict-induced risk aversion directly drives up oil prices, and high-intensity confrontations further amplify market concerns.
Market data shows that prior to the outbreak of the conflict, international oil prices had already risen significantly due to heightened geopolitical tensions, implicitly incorporating a war-risk premium of considerable magnitude. Industry insiders predict that if shipping through the Strait of Hormuz is disrupted, oil prices will surge substantially, and in extreme cases, price volatility could even reach levels comparable to that of a full-blown oil crisis.
Historical data shows that in 2020, after the attack on Soleimani, and in 2025 following Israel's "Rise of the Lions" operation, oil prices surged in the short term. However, when the Strait was not substantially disrupted, the premium quickly faded. This time, Iran has clearly stated "retaliation without limits," and shipping in the Persian Gulf has already been affected, making the uncertainty in the oil market far greater than before.
Costs are passed on layer by layer, and the plastic industry faces multiple pressures.
Crude oil price volatility rapidly transmits through the entire plastic industry chain, creating cost pressures across the board. As a core downstream sector of petrochemicals, the plastics industry relies on naphtha and fuel oil—derived from crude oil—as key feedstocks for basic plastic production. Rising oil prices directly drive up the production costs of basic petrochemical products, significantly increasing the costs of general-purpose plastic raw materials such as PE, PP, and PVC, thereby squeezing corporate profit margins.
Iran, as a global hub for methanol and sulfur exports, holds a significant share of the global methanol export market and sulfur supply. Both are critical raw materials for plastic processing. Export disruptions caused by the conflict have exacerbated global supply shortages, and rising base material costs have placed the industry under dual pressure.
In addition, shipping insurance premiums for the Persian Gulf routes have risen sharply, with significant increases in insurance rates related to Israeli ports. Tanker freight rates have also surged due to geopolitical risks, directly leading to a sharp increase in logistics costs for importing plastic raw materials. Plastic processing companies that rely heavily on raw material imports from the Middle East have been more severely impacted.
Supply structure differentiation, spot market sentiment fluctuation
The impact of the conflict on the plastics industry exhibits pronounced structural differences: For high-end plastics such as POE, import dependence remains relatively high; although domestic mass production has been achieved, capacity has not yet been fully ramped up, meaning fluctuations in overseas supply chains could still push up import prices. In contrast, for general-purpose plastics such as PE and PP, although domestic refining and petrochemical capacity expansion has improved self-sufficiency, the dependence on imported naphtha remains high, making cost pass-through from rising oil prices difficult to avoid.
In terms of market sentiment, during the initial phase of the conflict, traders are likely to stockpile and hold back supplies, pushing up spot prices in the short term. If the conflict does not escalate further, prices will revert to fundamentals once sentiment calms down. The pattern of "buying on expectations and selling on actual results" seen after the "Rising Lion" operation in 2025 may reappear.
Navigating Geopolitical Shifts: The Plastics Industry Seeks a Path Forward
In the short term, plasticizers enterprises need to closely monitor the situation, rationally arrange raw material procurement and inventory, hedge against price risks through price locking and hedging, optimize logistics channels, and reduce over-reliance on the Persian Gulf shipping route.
In the medium to long term, the conflict highlights the importance of energy self-reliance. Enterprises need to increase R&D and mass production of high-end materials, enhance the rate of domestic substitution, and accelerate the development of green new materials such as bio-based and recycled plastics, to reduce reliance on petrochemical raw materials and build a more resilient supply chain.
Overall, the impact of the conflict on the industry mainly depends on the escalation path of the conflict and the security of shipping through the Strait of Hormuz. If the conflict eases, price fluctuations will return to fundamentals; if shipping is disrupted, the plastic industry will face long-term cost pressures. Domestic plastic and chemical companies need to flexibly respond to uncertainties, seize the opportunity for transformation and upgrading, and enhance their risk resistance capabilities.
【Copyright and Disclaimer】This article is the property of PlastMatch. For business cooperation, media interviews, article reprints, or suggestions, please call the PlastMatch customer service hotline at +86-18030158354 or via email at service@zhuansushijie.com. The information and data provided by PlastMatch are for reference only and do not constitute direct advice for client decision-making. Any decisions made by clients based on such information and data, and all resulting direct or indirect losses and legal consequences, shall be borne by the clients themselves and are unrelated to PlastMatch. Unauthorized reprinting is strictly prohibited.
Most Popular
-
From Compliance to Competitiveness: Alpla’s Circular Design and Recycling Practices Driven by PPWR
-

Overseas News: PPG Announces Global 20% Price Increase; Sika Launches High-Performance Polyamide (PA) New Product; AIP Announces Nearly $10 Billion Acquisition
-

15 Companies, 30 Material Technologies: 2026 Rubber & Plastics Exhibition Visitor Guide (I)
-

Driving Intelligent Upgrades In Rubber And Plastics Industry! Preview Of Concurrent Activities At Chinaplas 2026 International Rubber & Plastics Exhibition (Part 2)
-

BASF Delivers First Batch of Innovative Cathode Materials for Semi-Solid-State Batteries to Weilan New Energy